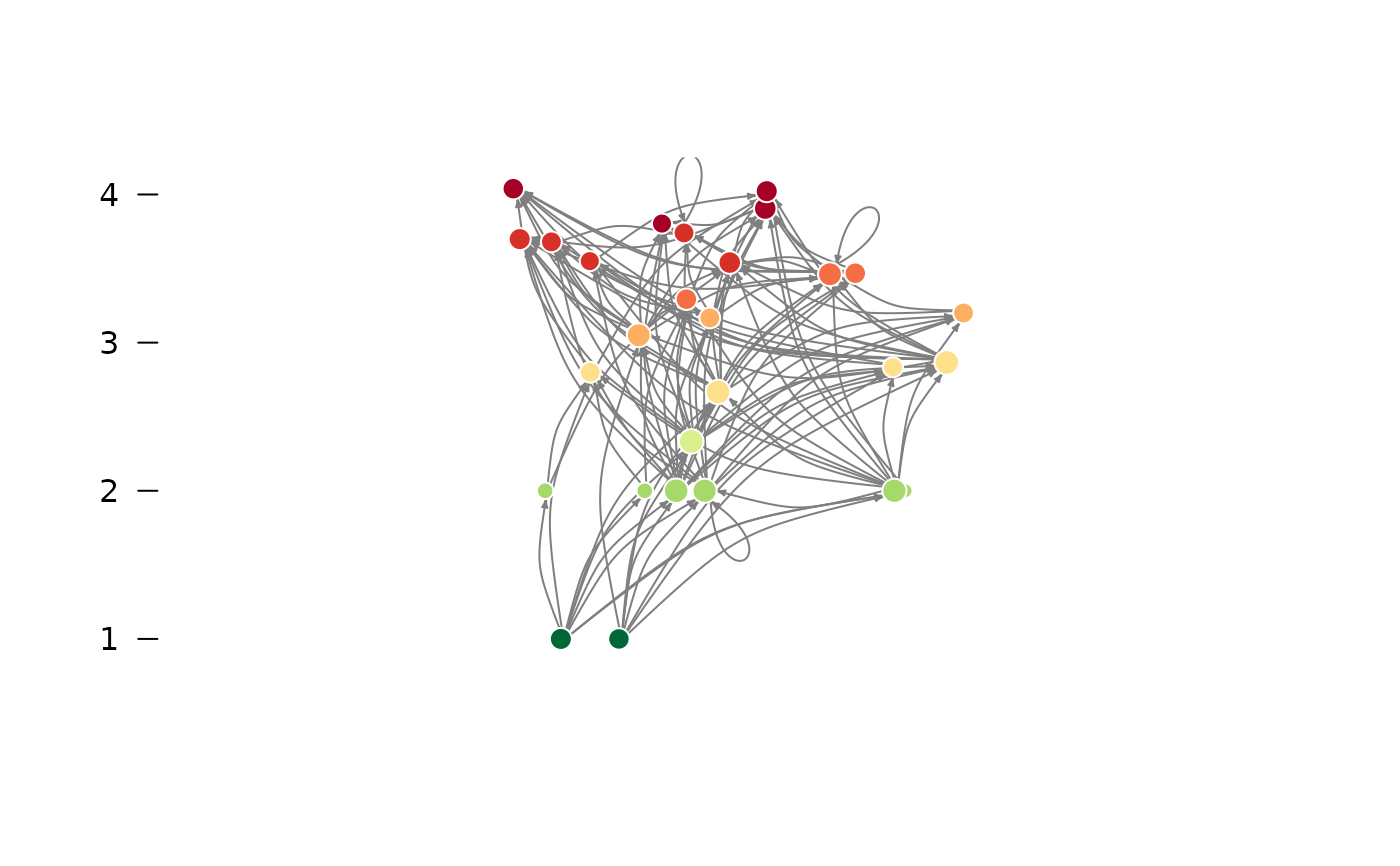
Plot ecological network organized by trophic level, with node size determined by the node degree, and modules.
Source:R/plotNetwork.r
plot_troph_level.RdPlot ecological network organized by trophic level, with node size determined by the node degree, and modules.
Usage
plot_troph_level(
  g,
  vertexLabel = FALSE,
  vertexSizeFactor = 5,
  vertexSizeMin = 5,
  tk = FALSE,
  modules = FALSE,
  lMat = NULL,
  weights = NA,
  community_obj = NULL,
  bpal = NULL,
  maxTL = NULL,
  ...
)
Arguments
- vertexLabel
logical plot vertex labels
- vertexSizeFactor
numeric factor to determine the size of the label with degree
- vertexSizeMin
numeric determine the minimum size of the label
- tk
TRUE generate an interactive plot using tkplot and returns a matrix with coordinates from
igraph::tkplot.getcoords()- modules
if TRUE plot modules in the x axis, obtained with the cluster spinglass algorithm
- lMat
Matrix of postions for the nodes
- weights
The weights of the edges for the
igraph::cluster_spinglass()community detection, either a numeric vector, NULL, or NA. if NULL and the network has a 'weight' attribute then that will be used, if NA then the 'weight' attributte is not considered.- community_obj
Insteado of calculating modules/communities with cluster spinglass take a community object
- bpal
if NULL it uses the "RdYlGn" RColorBrewer palette, else must be a vector of colors of length 11.
- maxTL
maximum trophic level to draw y-axis
- ...
Addittional parameters to the plot function
- ig
igraph object